
Overview
Application tracing and observability for AI agents. Capture runs, monitor latency, track cost and tokens, and debug failures across OpenAI, Anthropic, LangChain, LlamaIndex, and more.
Because AI is non-deterministic, debugging an agent without an observability tool is mostly guesswork. Good observability gives you the tools to see what happened inside a run, and why.
The core of this is application tracing: a structured record of every run that captures the exact prompt sent, the model's response, token usage, latency, and every tool or retrieval step in between.
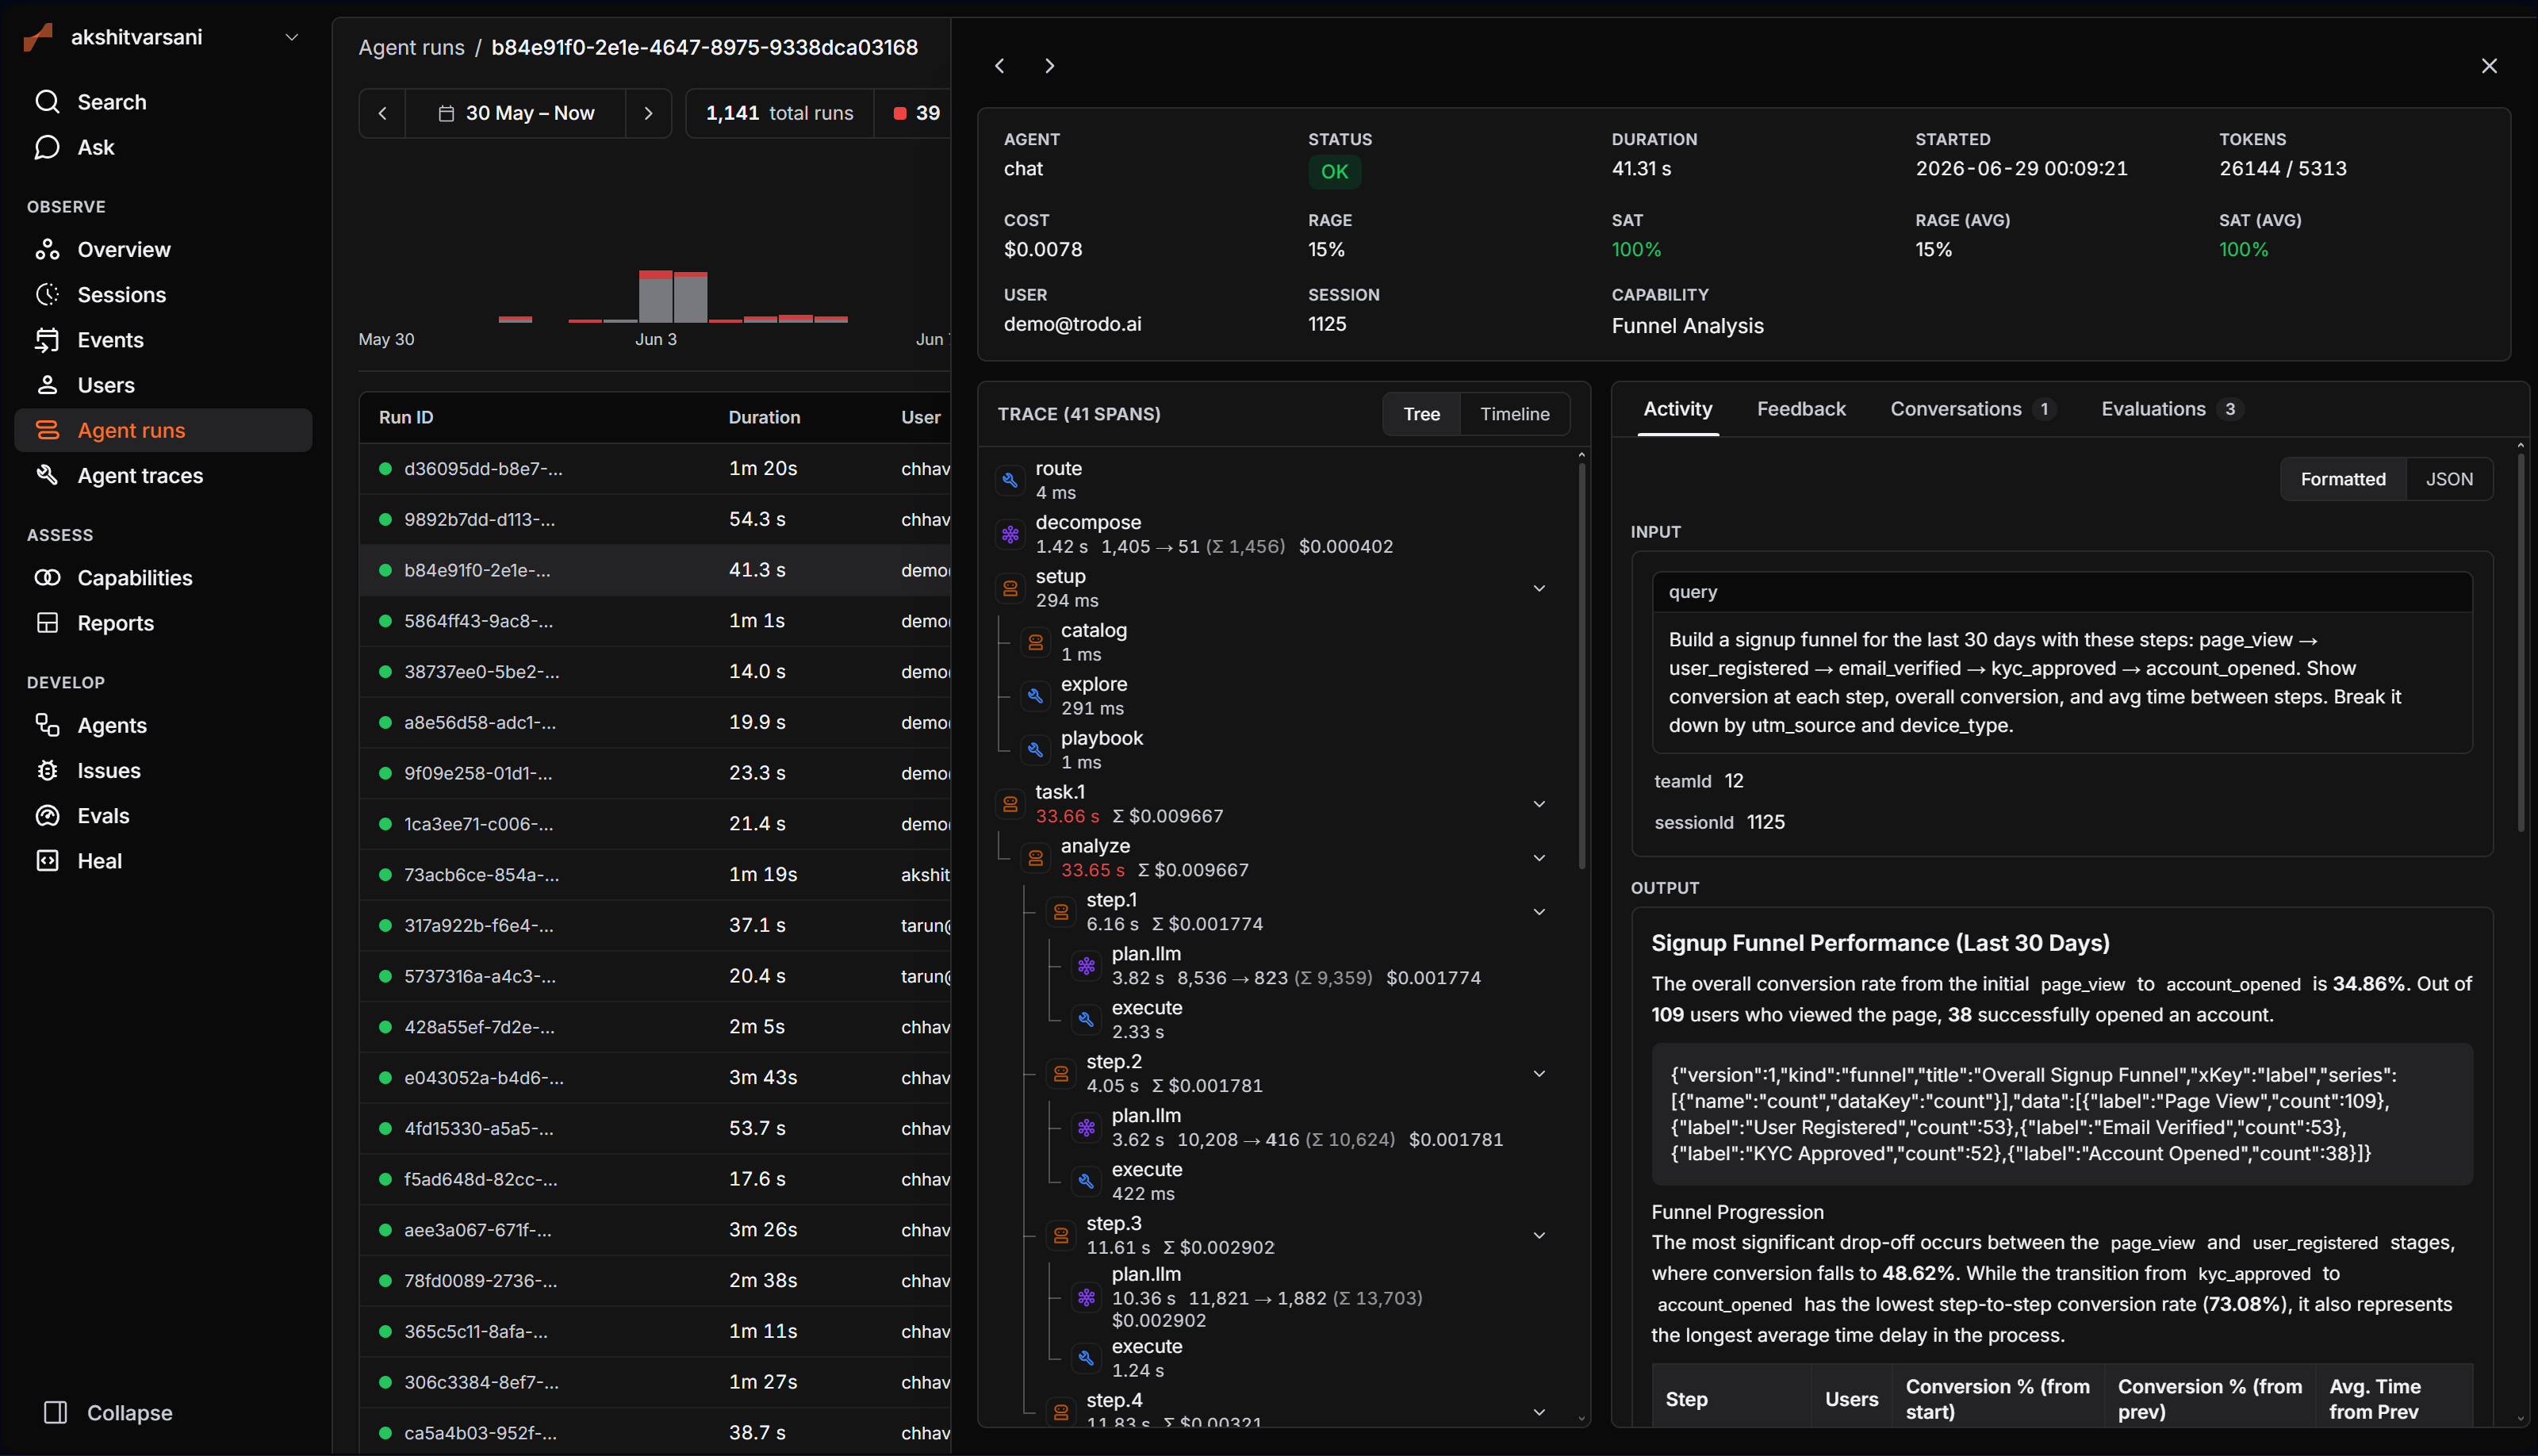
Trodo captures all of this as your agent runs. One wrap around your agent records the whole run as a tree of spans. Here's an example of a run in Trodo:
Getting Started
Start by setting up your first trace.
Take a moment to understand the core concepts of tracing in Trodo: runs, spans, and conversations.
Once you're up and running, you can add more to your traces. We recommend starting with:
- Group runs into conversations for multi-turn applications
- Identify the user behind each run
- Attach custom properties to your users
- Add metadata to your runs so you can filter them later
- Use custom trace IDs for distributed tracing
- Track cost and token usage
- Collect user feedback on runs
Already know what you need? Browse Features for guides on specific topics.