
Flows
Path analysis around an anchor event: what users do before and after, as a Sankey diagram.
Flows show the paths users actually take around an anchor event: the steps leading up to it and the steps that follow. It renders as a Sankey diagram of nodes and links.
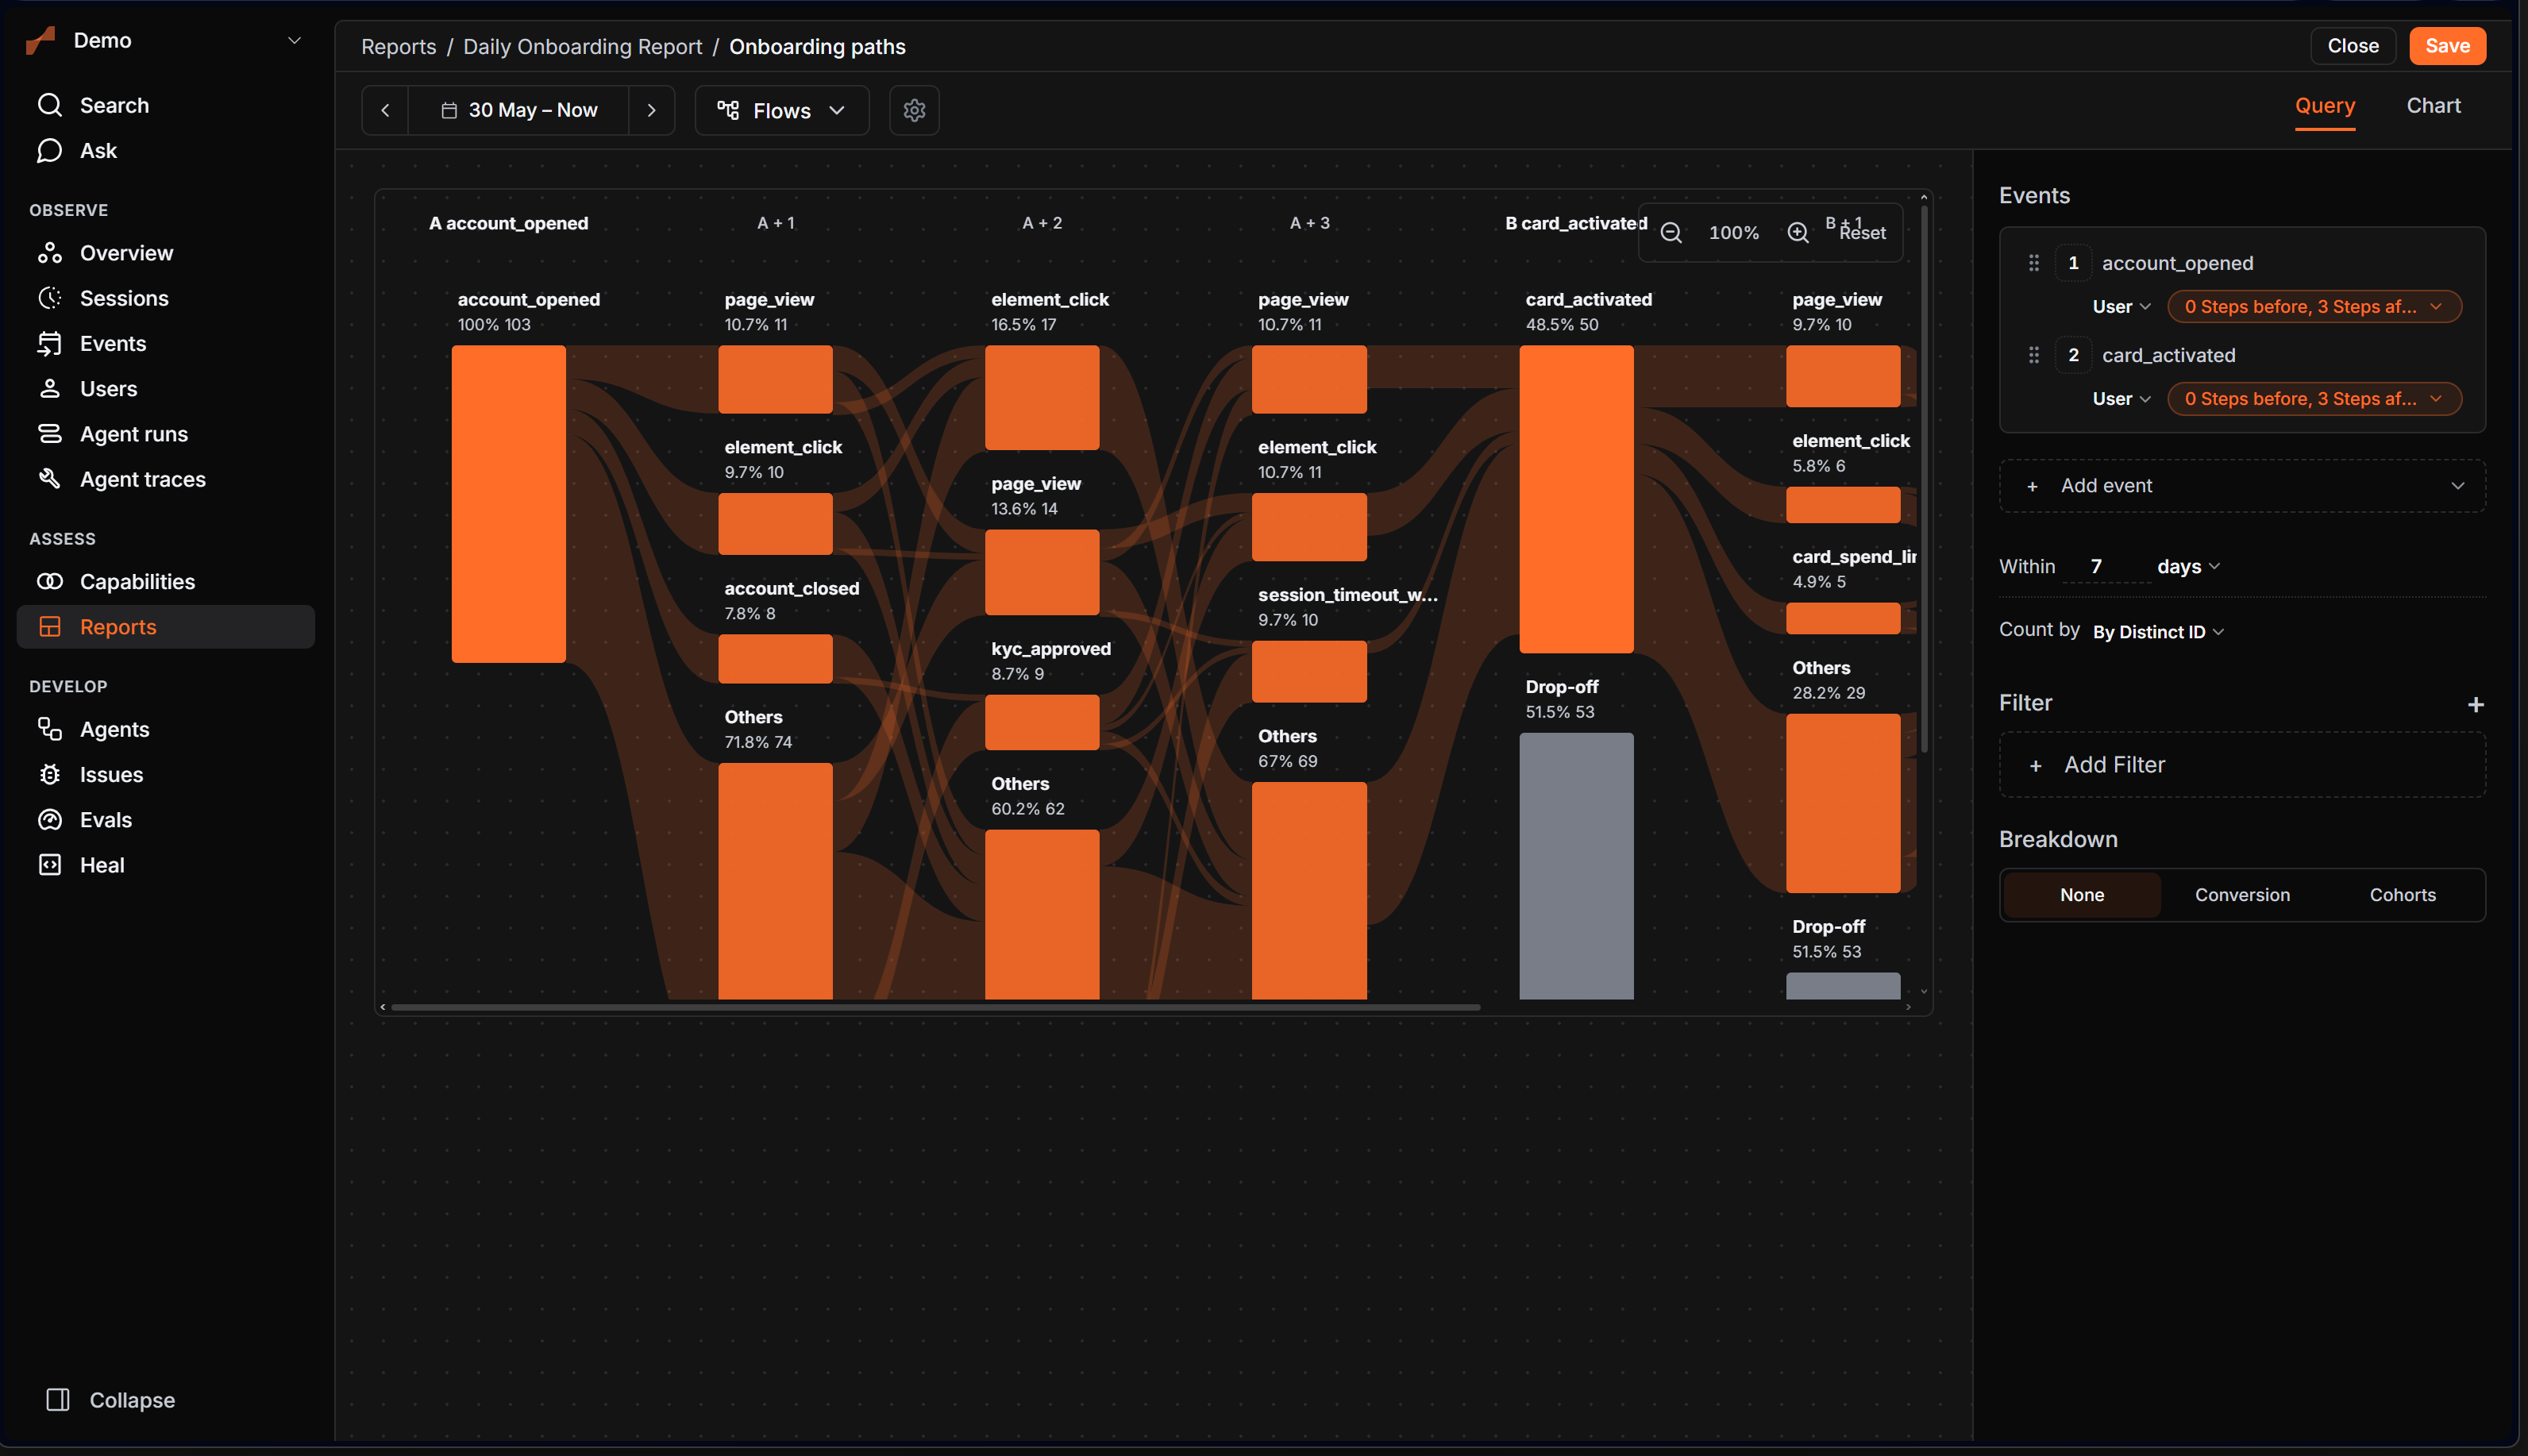
Anchor and steps
Pick one or more anchor events. For each, choose how many steps before and steps after to show (the default is 0 before and 3 after). Each path node carries a count and a percentage, and is marked as the anchor, a drop-off, a pass-through, or grouped into "Others".
Top paths
Switch to Top paths mode to list the most common distinct sequences through the anchor rather than the merged Sankey.
Breakdowns
Compare paths across segments:
- None: one flow for everyone.
- Conversion: split converted vs not-converted around the anchor.
- Cohorts: one flow per cohort.
Conversion can be measured by distinct user, totals, or sessions.
Next
- Funnels when you already know the exact steps
- Filters and cohorts to scope a flow