
Insights
Time-series and breakdowns of any metric: event counts, unique users, sessions, or a numeric property.
Insights is the everyday report: pick a metric, pick a time interval, and optionally break it down by a property. It runs on both events and agent runs and spans.
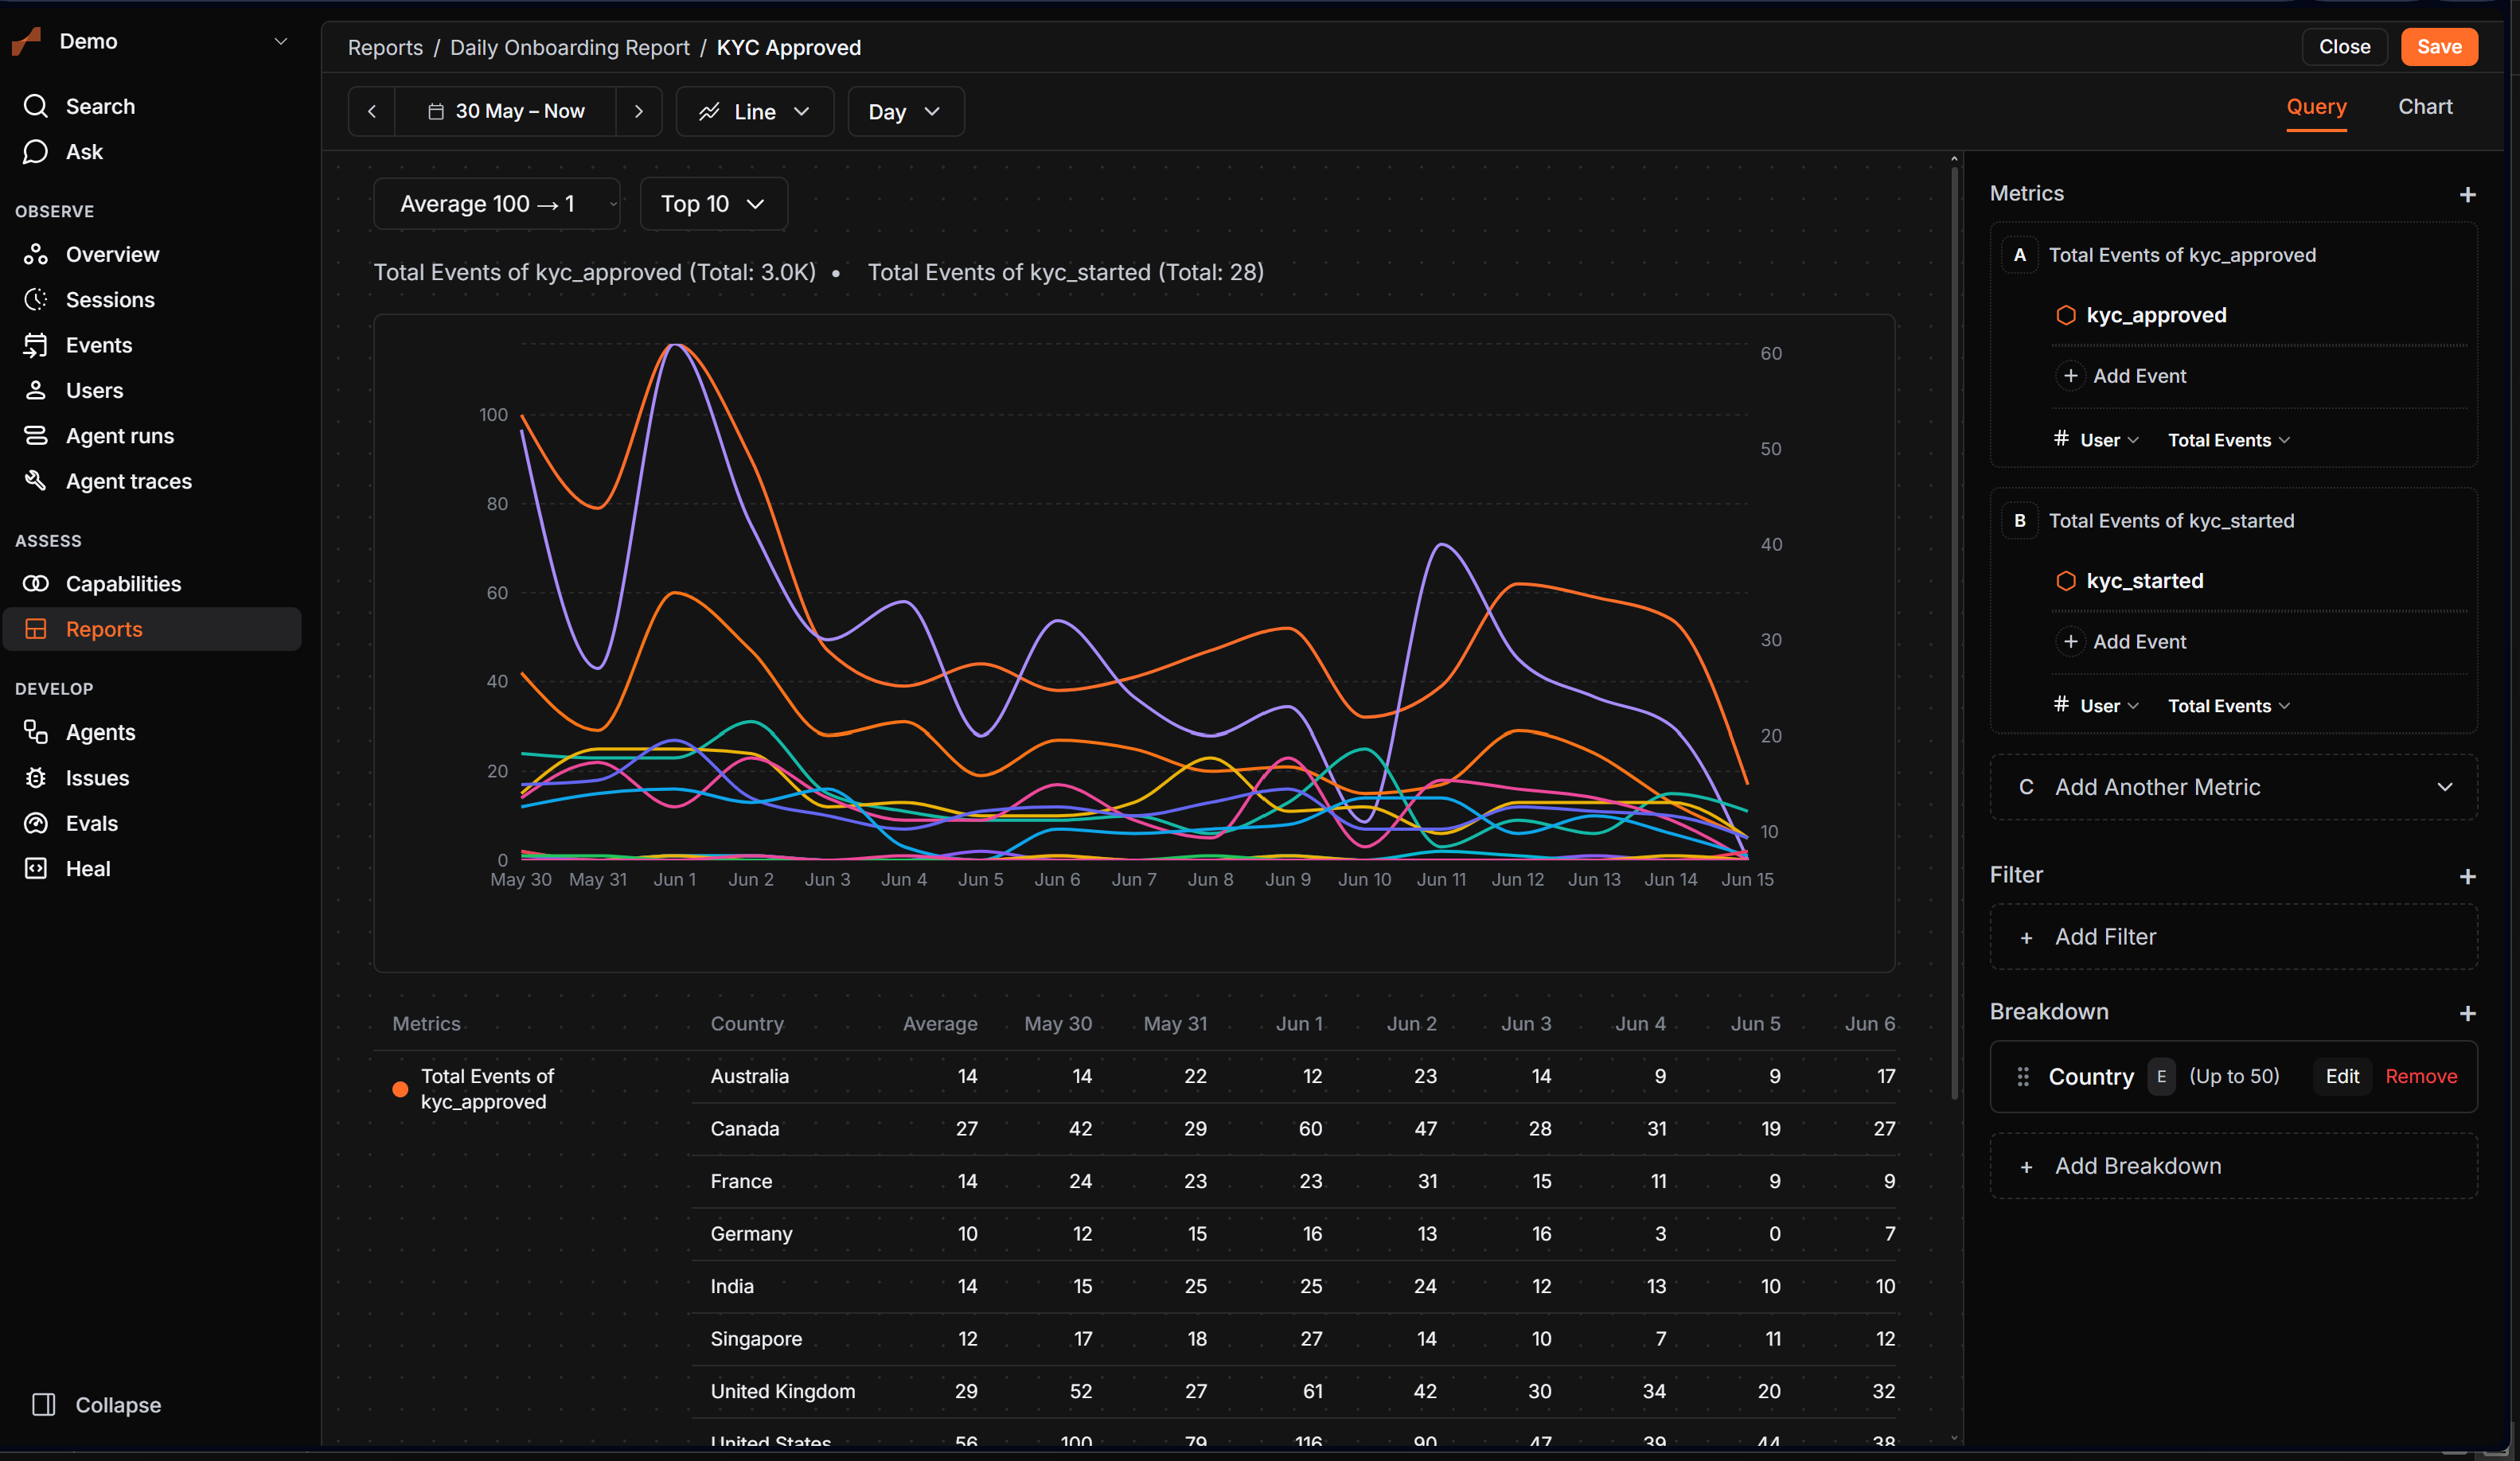
Metrics
Choose what to measure:
| Metric | What it counts |
|---|---|
| Total Events | Every matching event (count). |
| Unique Users | Distinct users (uniques). |
| Total Sessions | Distinct sessions (sessions). |
| Property value | sum, average, min, or max of a numeric property. |
You can count by User (default) or by a group (a company or workspace, see Groups).
Time interval and chart
Bucket results by hour, day, week, or month. The interval control appears for the time-series chart types.
Chart types: Line, Stacked Line, Column, Stacked Column, Bar, Stacked Bar, Pie, Table, Metric. Use Metric for a single number (a KPI tile on a board), Table for raw breakdown rows, and the line and column types for trends.
Breakdowns
Break a metric down by any property (for example country or plan). Trodo returns the top values (10 by default, up to 50) and groups the rest into Other. Breakdown rows can be sorted alphabetically or by value.
Filters
Every Insight can be filtered by event properties, custom properties, or a saved cohort. See Filters and cohorts for the full operator list.