
Results and analysis
Read what an eval decided: every verdict and its path, Analysis with versions side by side, marking results wrong, the scores in your trace views, searching traces by eval results, and alerts on evals.
An eval opens on its results. The header says which version is in production and whether the eval is on, and holds Lucid, Create alert, Versions and Edit. Below it, three tabs share one set of controls:
| Control | |
|---|---|
| Verdicts · Queue · Analysis | Every result; this eval's items waiting for a person; the numbers and charts. |
| Filter | Narrow all three tabs to traces whose walk went through chosen Steps, or took a chosen Path. |
| Version | All versions, or one version's results only. |
| Window | Last 24 hours, 7, 30 or 90 days. |
Verdicts
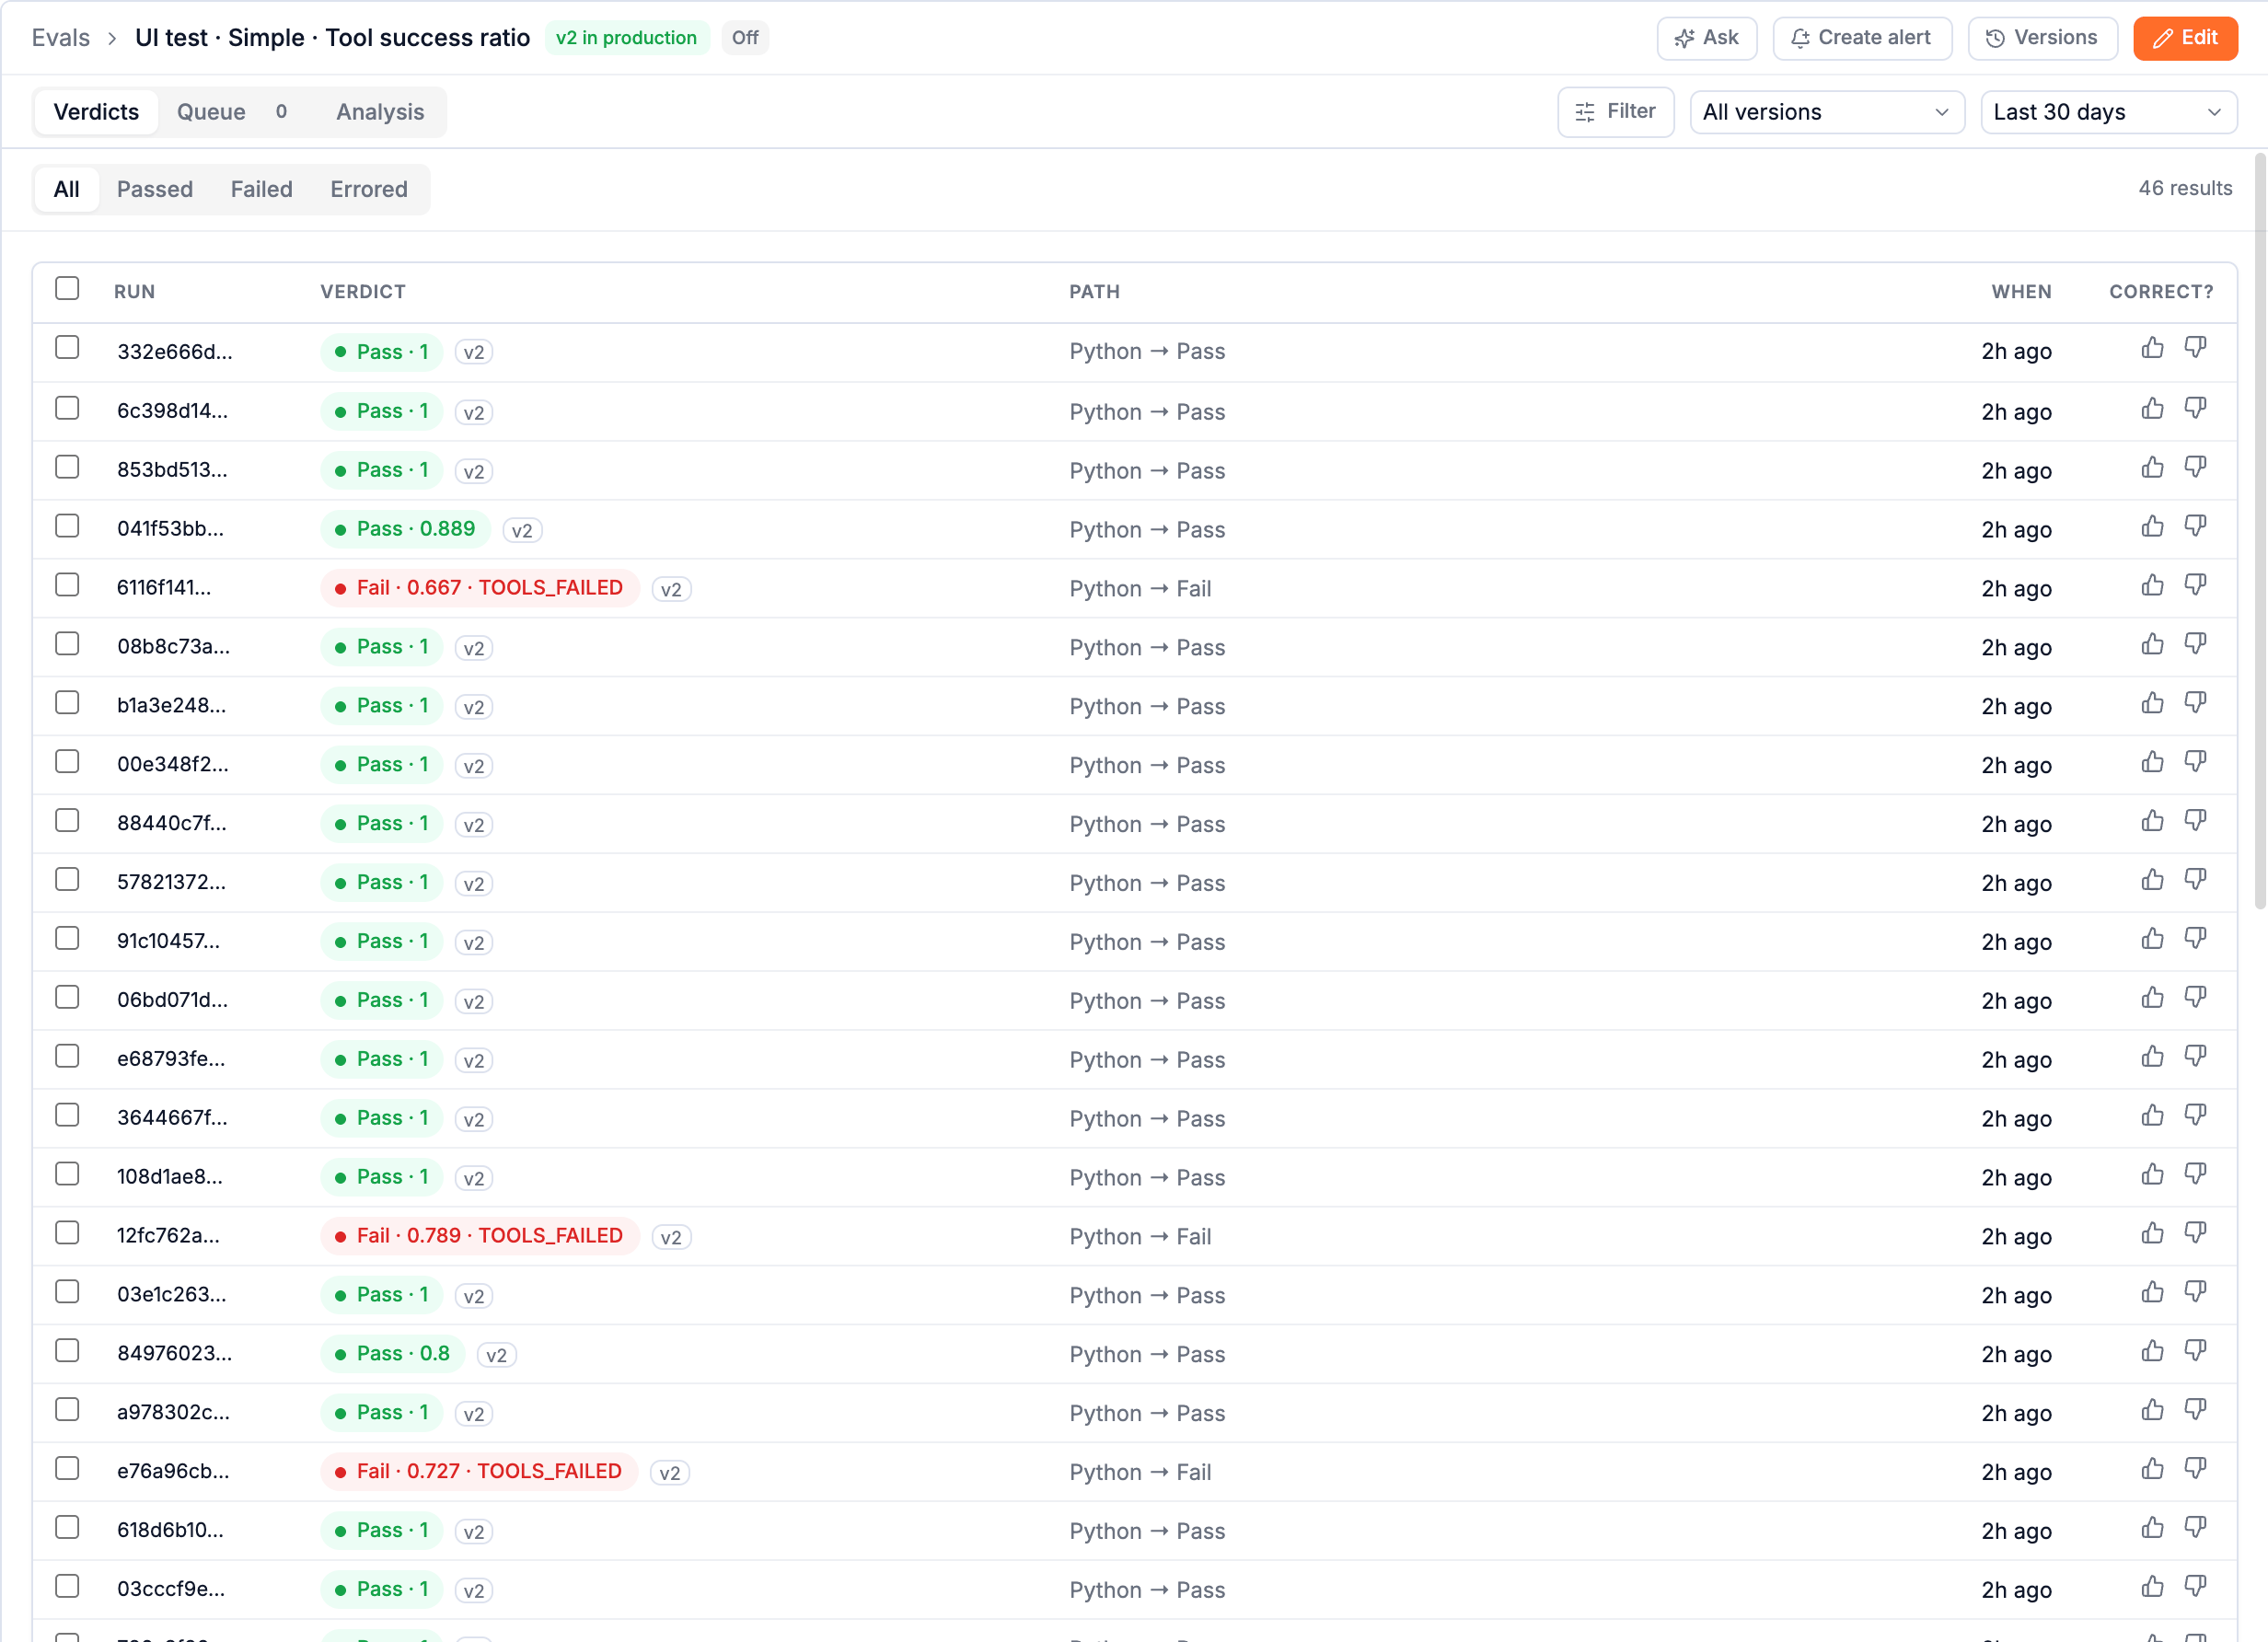
One row per result, newest first: the run, span or conversation it scored; the verdict (Pass · 0.889, Fail · 0.667 · TOOLS_FAILED) with the version that decided it; the path; when; and Correct?. Filter by All · Passed · Failed · Errored; the count on the right is what is listed.
Click a row to open its path:
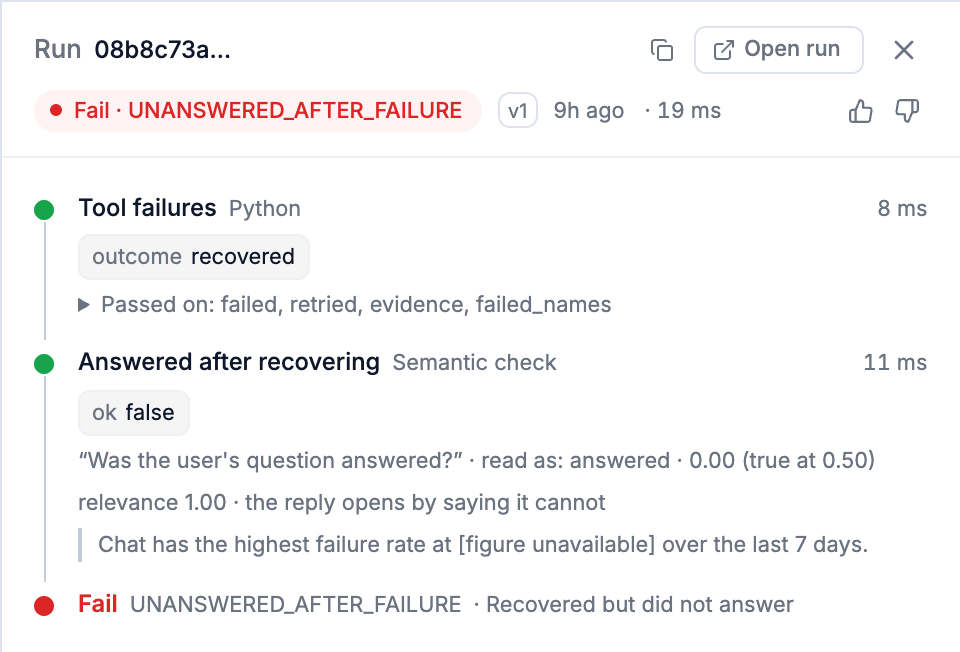
Each step shows what it answered, its time and cost, the judge's reasoning, a Semantic check's reading (8 of 15 claims supported, read as: answered · 0.00) and what it passed on. The end shows the ending's name and reason. Open run shows the full trace.
Marking results wrong
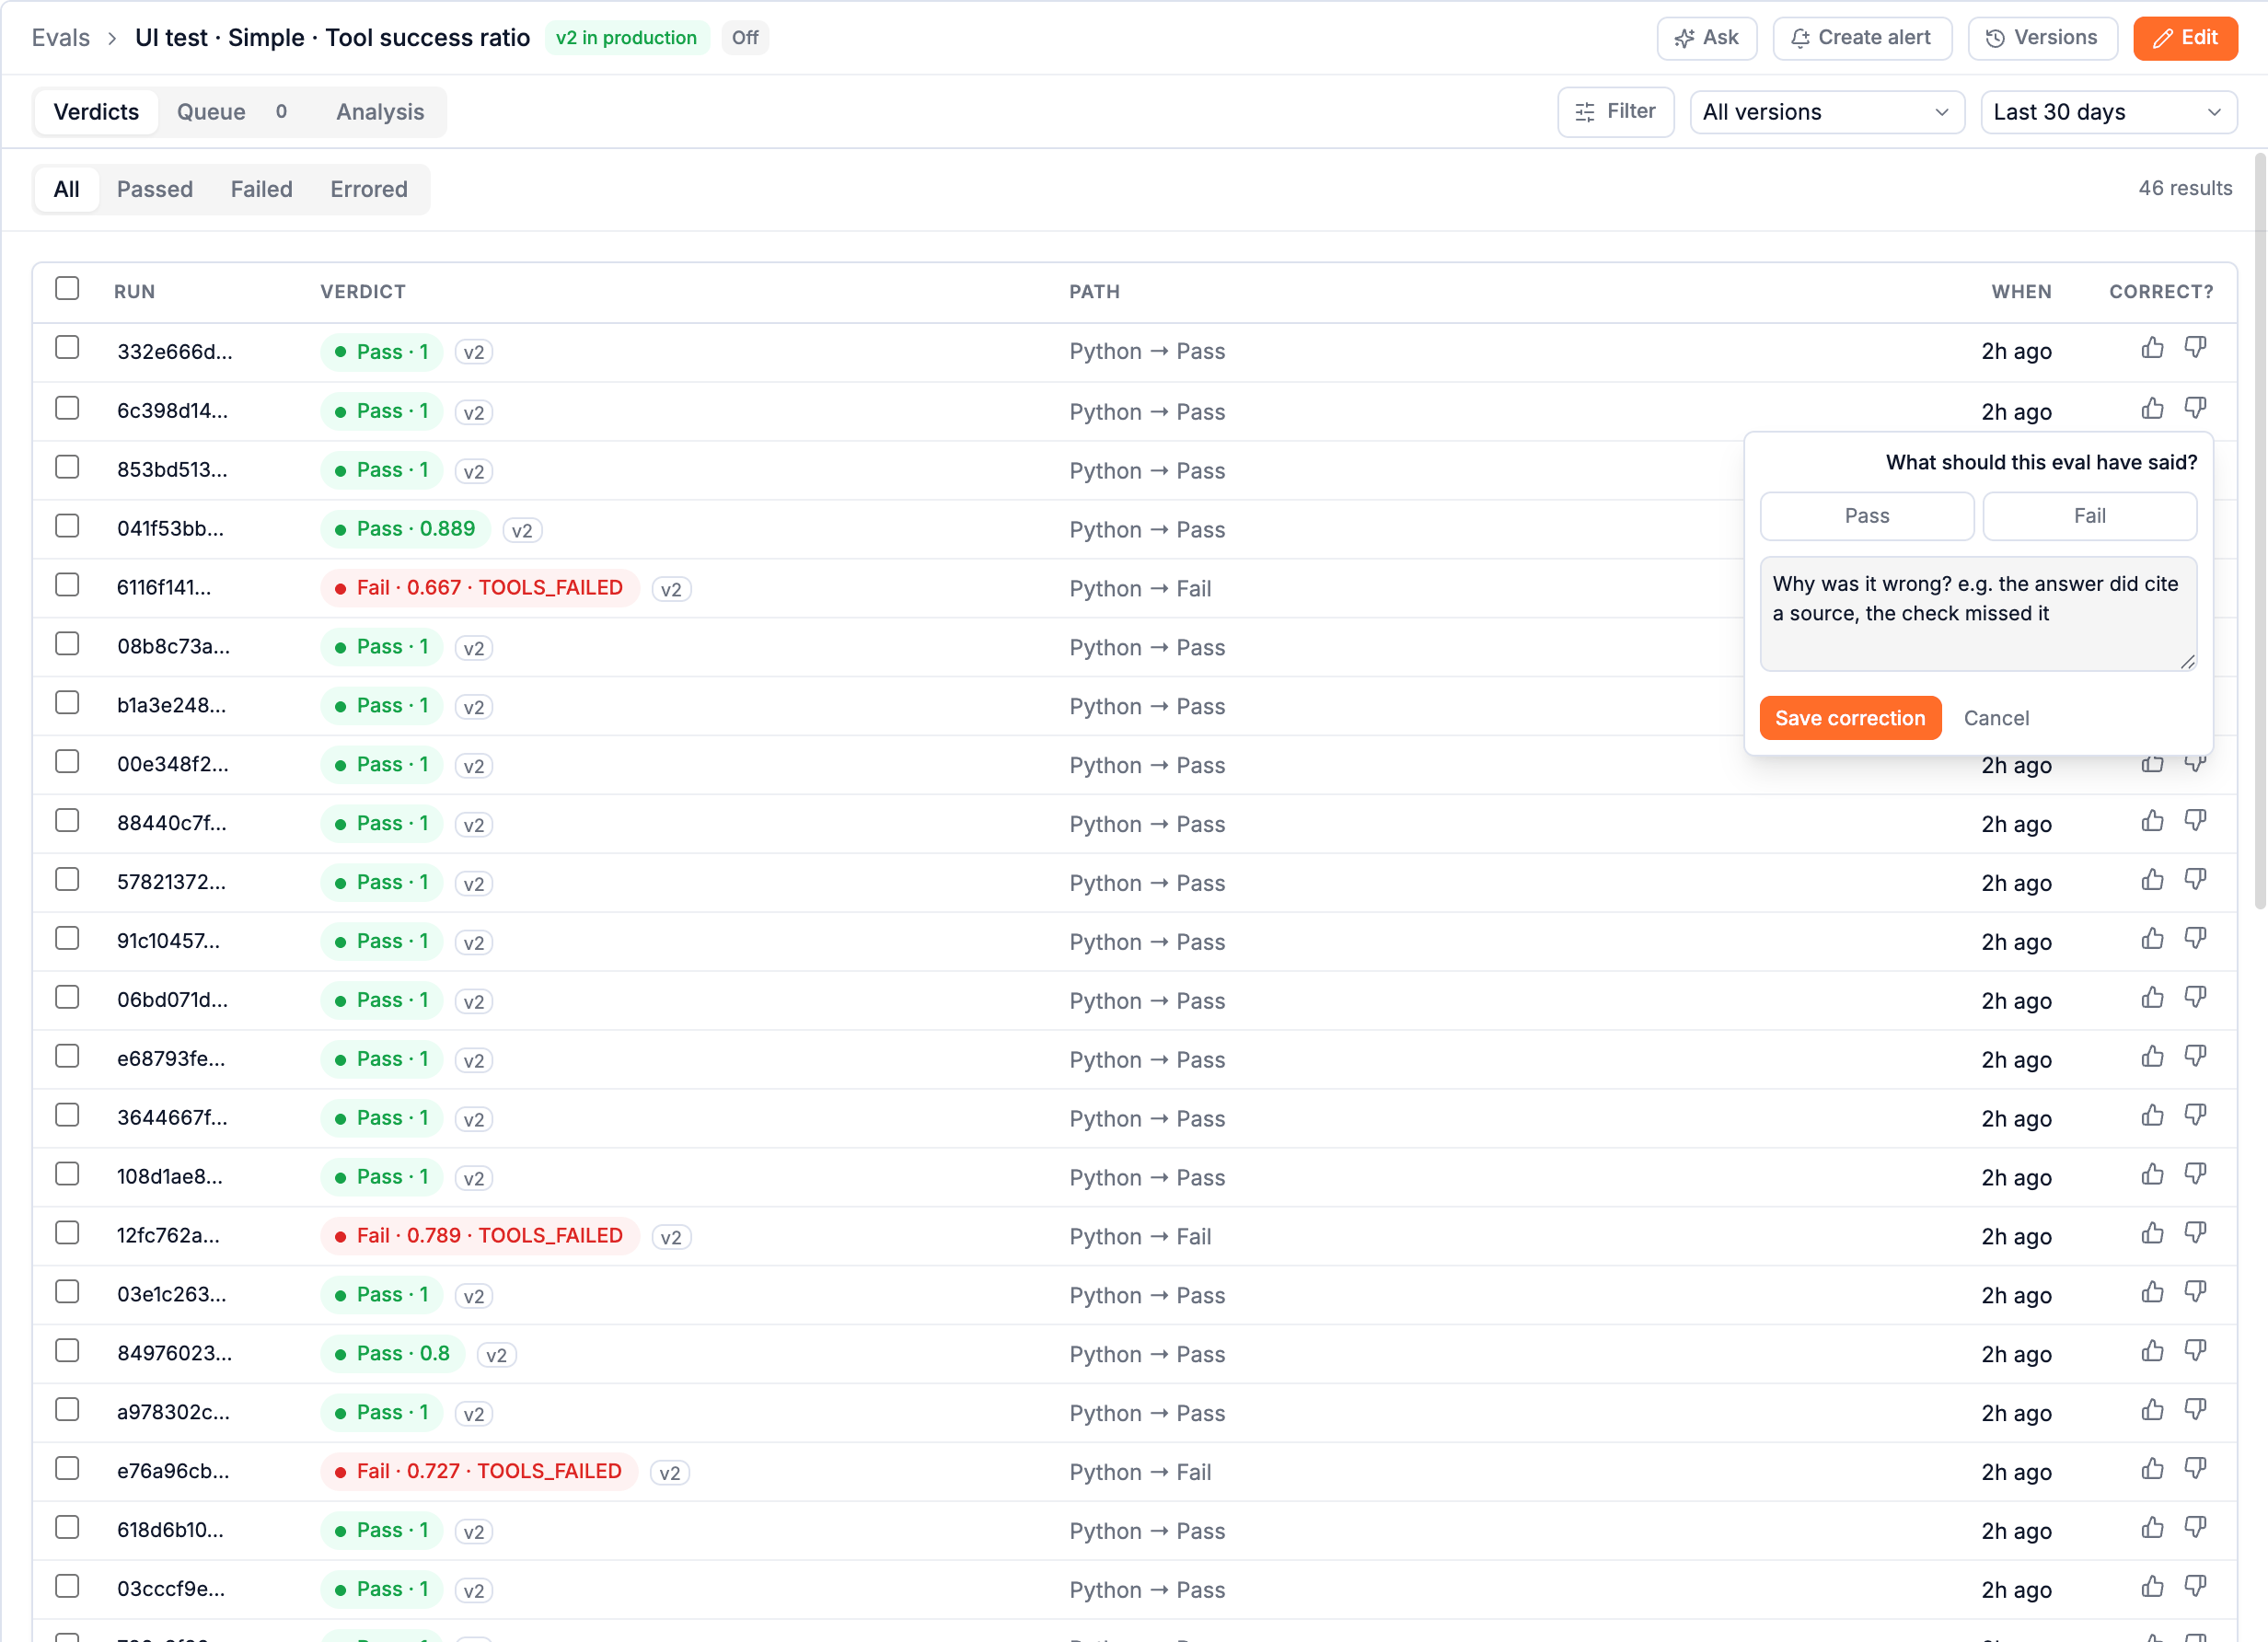
An eval is only as good as its verdicts, and you are the best judge of them. On any decided result, 👍 says the eval got it right; 👎 opens What should this eval have said?: pick Pass or Fail and say why.
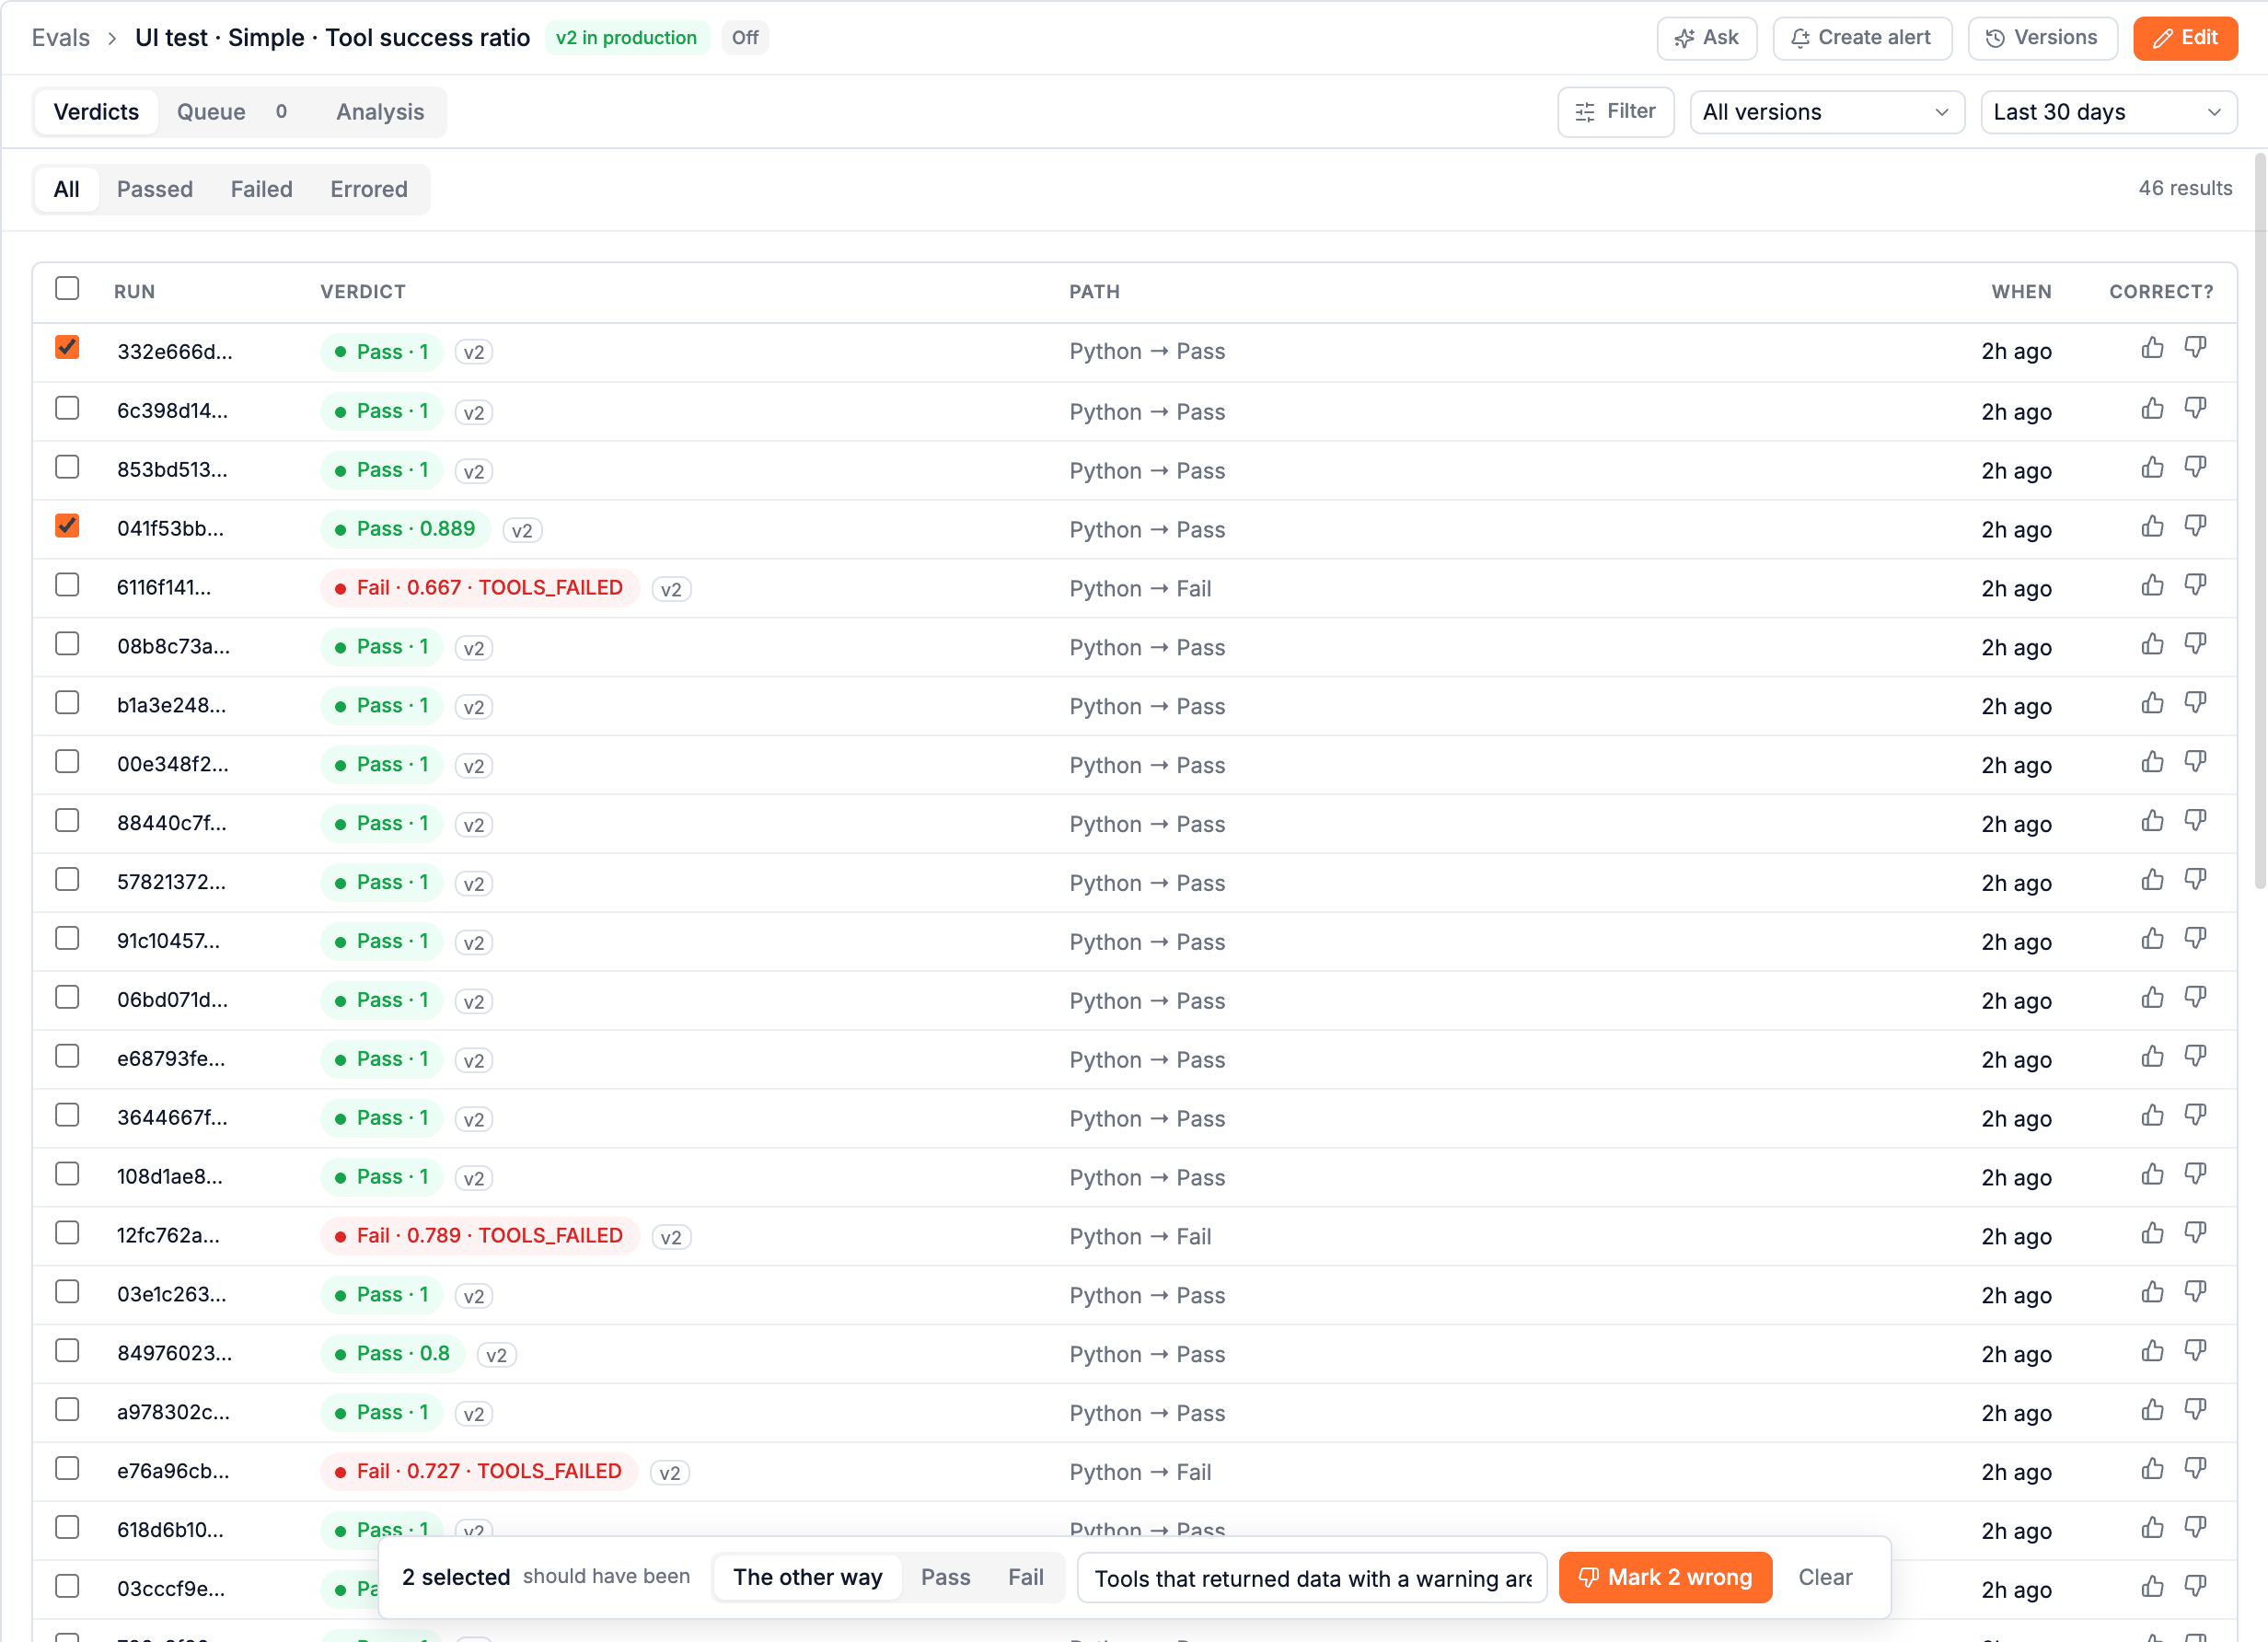
To mark several at once, tick their boxes (or the one in the header, for the whole page). A bar appears at the bottom: should have been The other way, Pass or Fail, one reason for all, Mark N wrong.
Either way, Lucid opens beside the page with a message ready to send: the eval, each result with what the eval said and what you say it should have been, your reason, and the instructions: read each result and its trace, say where it disagrees with you, find the step that decided wrongly, and propose the change. Edit it or send it. The proposal lands in Proposed changes.
Every mark is also a label: it counts toward Marked wrong on Analysis, toward the Results marked wrong alert measure, and as evidence the next time the eval is improved.
Analysis
The same window as numbers and charts.
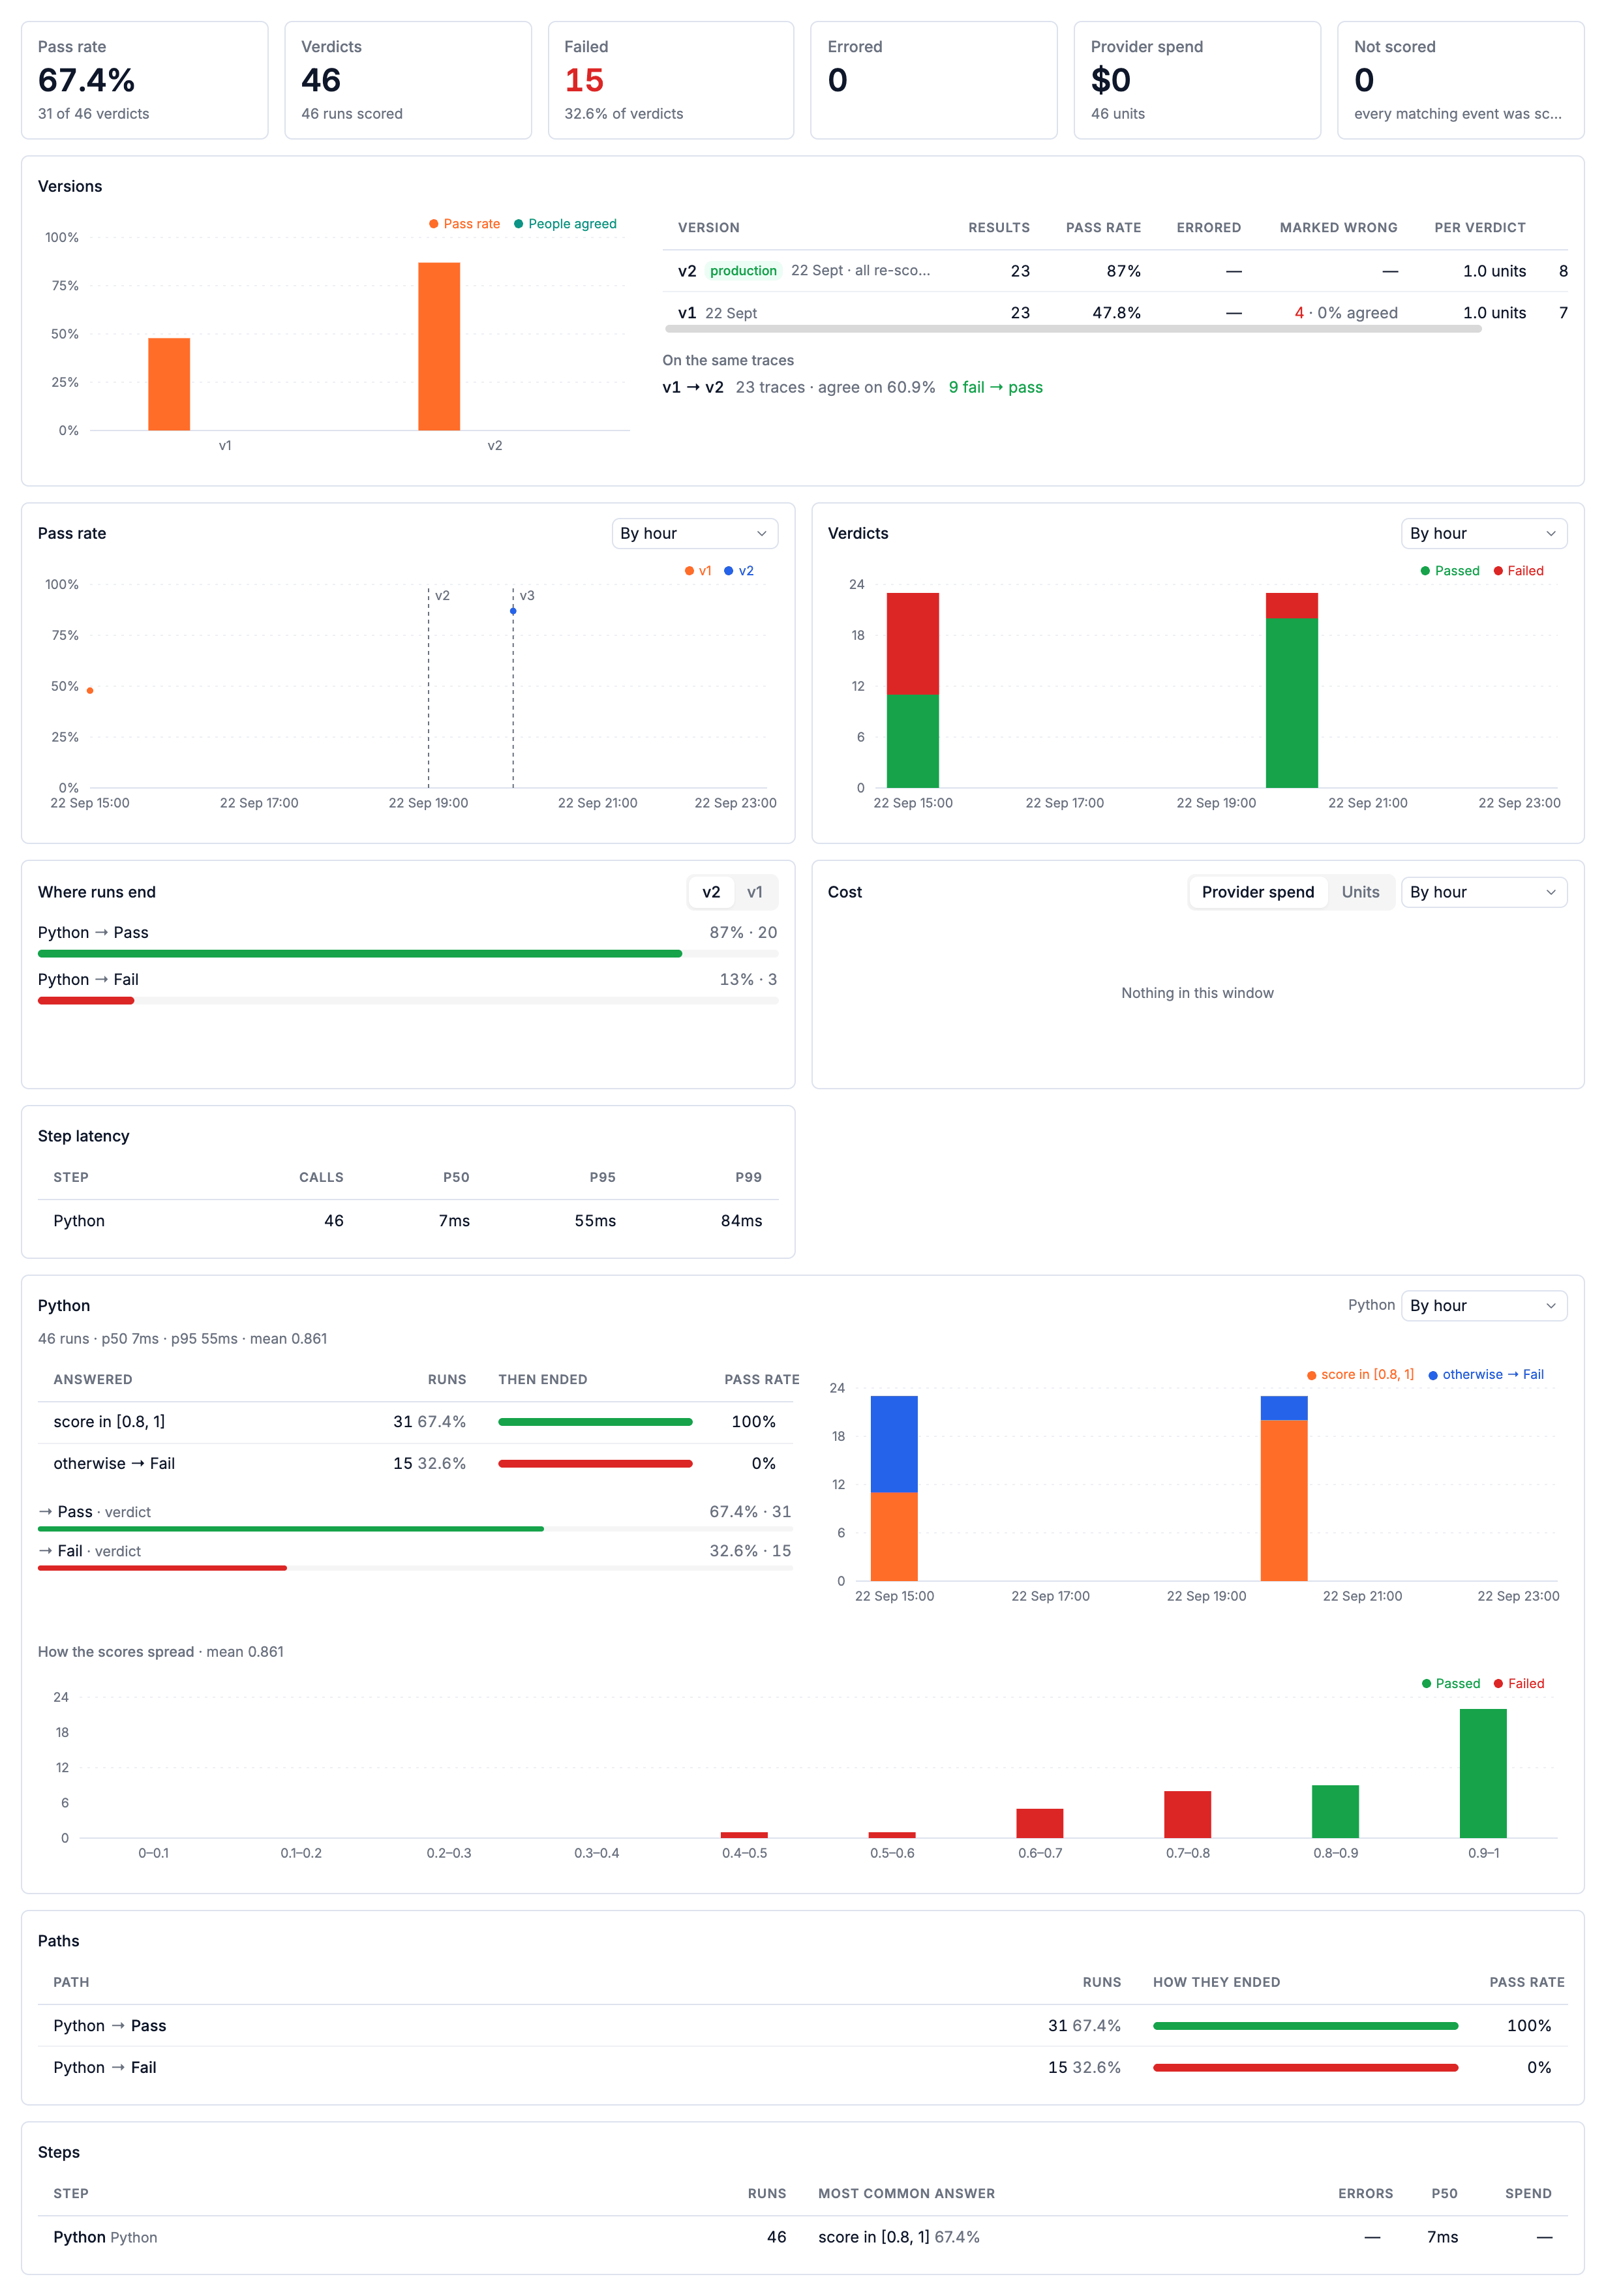
| Card | What it shows |
|---|---|
| Tiles | Pass rate (passed ÷ decided), verdicts, failed, errored and waiting, provider spend and units, and Not scored with the main reason. |
| Versions | Every version side by side; see below. |
| Pass rate | Per version, each its own line; a dashed line marks where a version went into production. Pass rate counts decided results only: waiting and errored are states, not failures. |
| Verdicts | Passed, failed, errored and waiting over time. |
| Where runs end | The step whose decision ended each run, and the ending it led to. A run that ends at a cheap step never reached the judge. That is triage at work. |
| Cost | Provider spend (your judge calls) or Units (steps run), by live traffic, re-scoring and audit. Two bills, never added. |
| Step latency | Calls, p50, p95, p99 per kind of step. |
| Paths | Every walk the eval took, its share, how those runs ended. Click one to see just those runs. |
| Steps | Every step: runs, most common answer, errors, p50, spend. Click one to add a card for it: its answers and how the runs that got each one ended, its routes, its answers over time, and, for a score, how the scores spread. |
| Screen accuracy | From the audit slice: how often each screen's shortcut disagreed with the full path. |
Charts group by hour, 6 hours, 12 hours or day on your clock; each has its own Cluster by.
Versions side by side
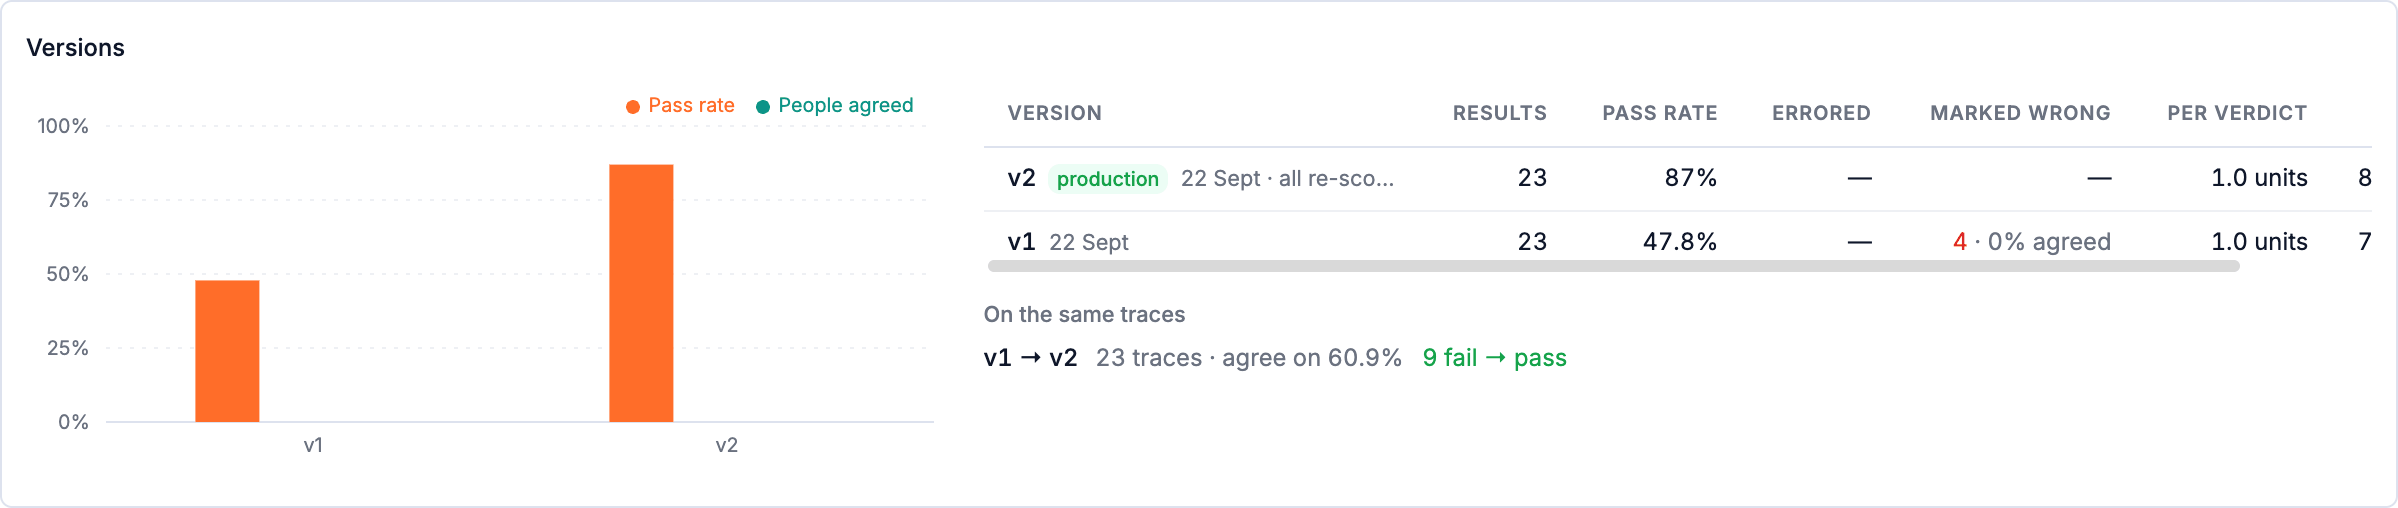
Every version over the same window: results, pass rate, errors, how many results people marked wrong and how often they agreed with it, cost per verdict, and latency. Click a row to see the whole page for that version alone: every number is then that version's, compared with production: Pass rate · v1 47.8% · −39.1 pts vs v2.
Two versions live at different times score different traffic, so their pass rates aren't a like-for-like comparison. On the same traces is: for every pair of versions that scored the same traces (after a re-score), how many they both decided, how often they agree, and which way the rest flipped: v1 → v2 · 23 traces · agree on 60.9% · 9 fail → pass.
In your trace views
Open any run, span or conversation and go to Scores. The Evals section lists every eval that scored it, with the ending's name and what it decided, and 👍 / 👎.
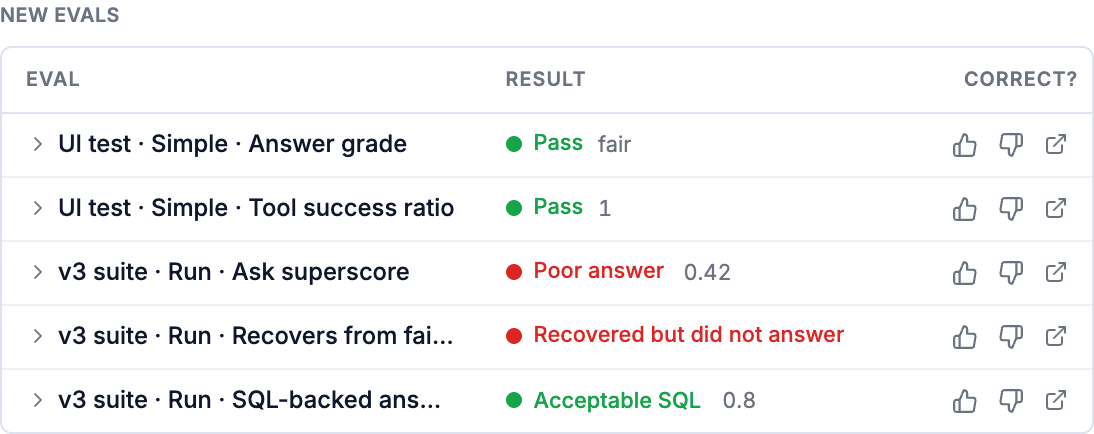
Expand a row to see each step, what it answered and what it measured. A run lists its spans' results under Spans in this run; a conversation lists its runs' under Runs in this conversation. The Scores badge counts all of them.
Searching traces by eval results
The search on Traces understands eval results (last 90 days):
| Search | Finds |
|---|---|
"Went well"=fail | Runs the Went well eval failed |
"Answer quality">0.7 | Runs that eval scored above 0.7 |
HALLUCINATION | Any result with that reason code, ending name or step name |
ok=false | Any step that answered false |
similarity>0.9, score<0.5 | What a step measured |
failed, passed, errored | By outcome |
Quote a name that has spaces in it. Combine terms with spaces, commas or and: "Went well"=fail and "Tool success">0.8.
Alerts on evals
Create alert on an eval's page opens a new alert already scoped to it. Watch:
| Measure | |
|---|---|
| Failures | Failed results in the window |
| Pass rate | Passed ÷ decided |
| Decisions | Decided results |
| Errored · Waiting for a person | |
| Score | Average, min, max or a percentile of the ending's score |
| Marked wrong | Results people marked wrong |
| Audit disagreements | Where a screen and the full path disagreed |
Re-scored history never counts toward an alert. An alert on an eval can also start an agent: that is exactly what self-improving sets up. See Alerts.
Testing and versions
Test an eval on real traces before it scores anything, save versions with notes, set one as production, restore an old one, and re-score history.
Self-improving evals
An alert on the eval and an agent that has Lucid improve it when the alert fires: proposed changes to the eval, fixes for your agent, and how you decide what ships.